Anthropic has released a game-changing update for Claude AI that has got everyone in the tech world buzzing. If you have ever tried to understand complex data through a chatbot, you know how frustrating it can be when you are flooded with walls of text. Well, Claude visual responses are here to fix that in a major way. This new feature represents a significant leap forward in how we interact with AI assistants, making data more accessible than ever before for students, professionals, and curious minds alike across all age groups and skill levels.
What Exactly Are Visual Responses?
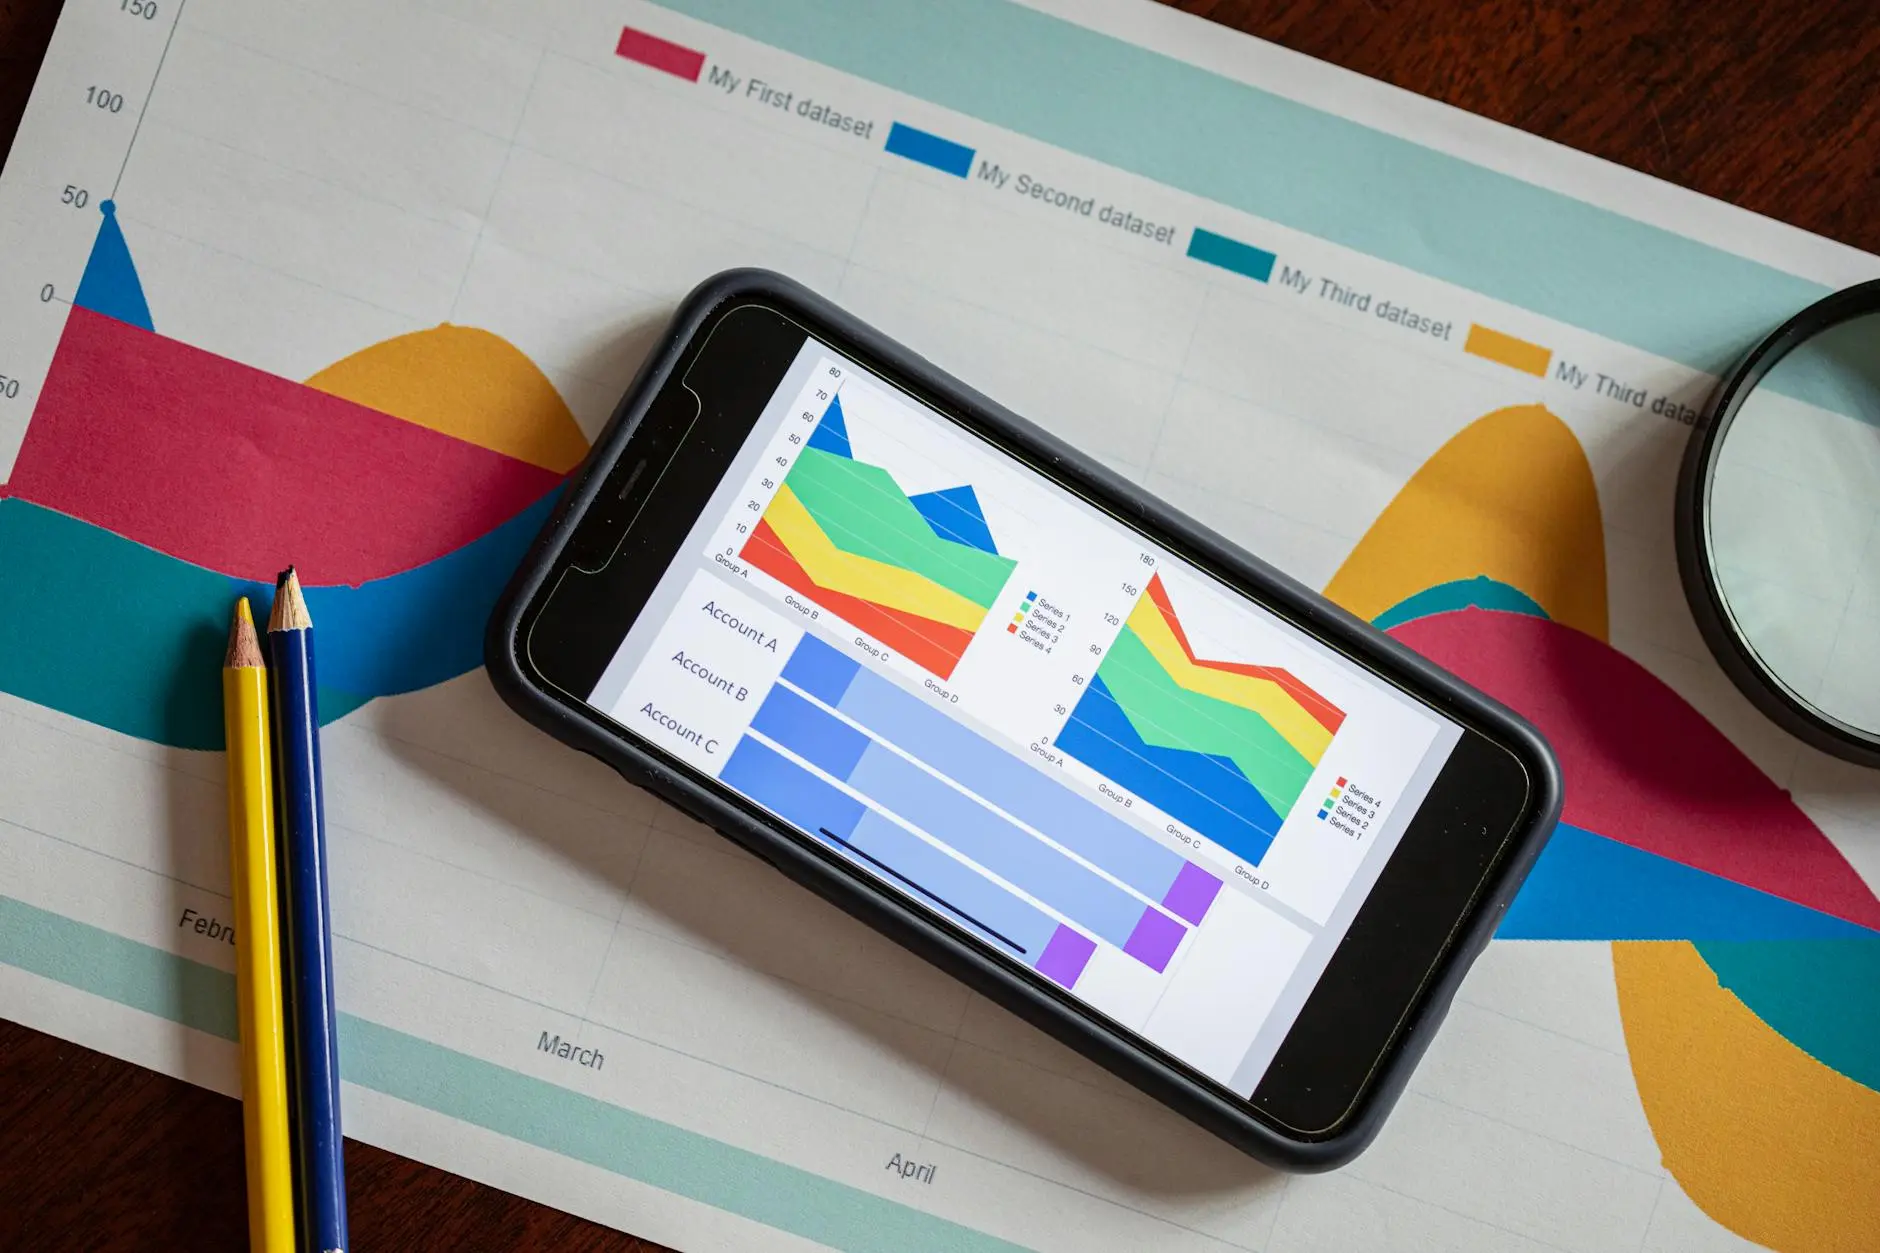
Imagine asking Claude about stock trends, climate data, or even your own budget spreadsheet, and instead of getting a wall of text, you get interactive charts, graphs, and visuals that update in real-time as you ask follow-up questions. That is exactly what Anthropic announced with Claude visual responses feature. According to the company official announcement reported by TechCrunch, the feature is now available in beta for all plan types meaning anyone can try it out without paying extra for access.
The visual responses are not just static images either — they are dynamic and highly interactive. When you ask Claude to compare two datasets or explain complex relationships, the AI generates charts on the fly that adapt as your conversation evolves. Think of it like having a professional data analyst right in your chat window, but one who speaks the language of the internet. The technology behind this uses advanced rendering capabilities to create meaningful visualizations that respond perfectly to the context of your questions.
As reported by 9to5Google, this puts Claude ahead of competitors like Gemini when it comes to visual explanations in real-time conversations. You can learn more about the feature from their detailed coverage at 9to5Google. While other AI assistants might only show static visualizations, Claude approach lets the visuals evolve dynamically with each new question you ask.
Why Gen Z Should Care About Claude Visual Responses
The younger generation processes everything visually by default these days. Long paragraphs of text? Nah, that is so last decade. Detailed charts that break down the info at a glance? That is more like it for modern learners. Whether you are a student trying to understand economic trends for a research paper, a budding investor checking crypto markets for your first trade, or just someone curious about climate data and global warming statistics, visual responses make complex information actually digestible and engaging.
This is especially relevant for students who need to visualize data for presentations and research projects throughout their academic careers. The feature is also incredibly useful for anyone into side hustles or investing. Instead of reading lengthy market analyses that take hours to parse, users can ask Claude to visualize market trends and get instant visual breakdowns that would have taken forever to compile manually. Your trading game just leveled up significantly with this new tool.
According to Forbes, Anthropic is actively positioning Claude as a new interface for work in the enterprise space. You can read more about their enterprise push and future plans at Forbes. Research from Stanford University has also shown that visual learning significantly improves information retention compared to text-only content, making this feature particularly valuable for educational purposes.
The Future of AI Conversations
Claude visual responses represent a fundamental shift in how we interact with AI technology in everyday life. The future is not just about having smarter conversations with AI — it is about having conversations that actually help us see the big picture in our data and understand complex topics more quickly. This could be the beginning of an entirely new era where AI becomes a true visual thinking partner for everyone from students to Fortune 500 executives.
As more features like this continue to roll out across the AI industry, AI assistants will become indispensable tools for work, school, and daily life. The key for young people is learning how to leverage these powerful visual capabilities to enhance productivity and understanding across all subjects. This is particularly important as the job market increasingly demands data literacy skills from all graduates entering the workforce.
Comments 0
No comments yet. Be the first to share your thoughts!
Leave a comment
Share your thoughts. Your email will not be published.