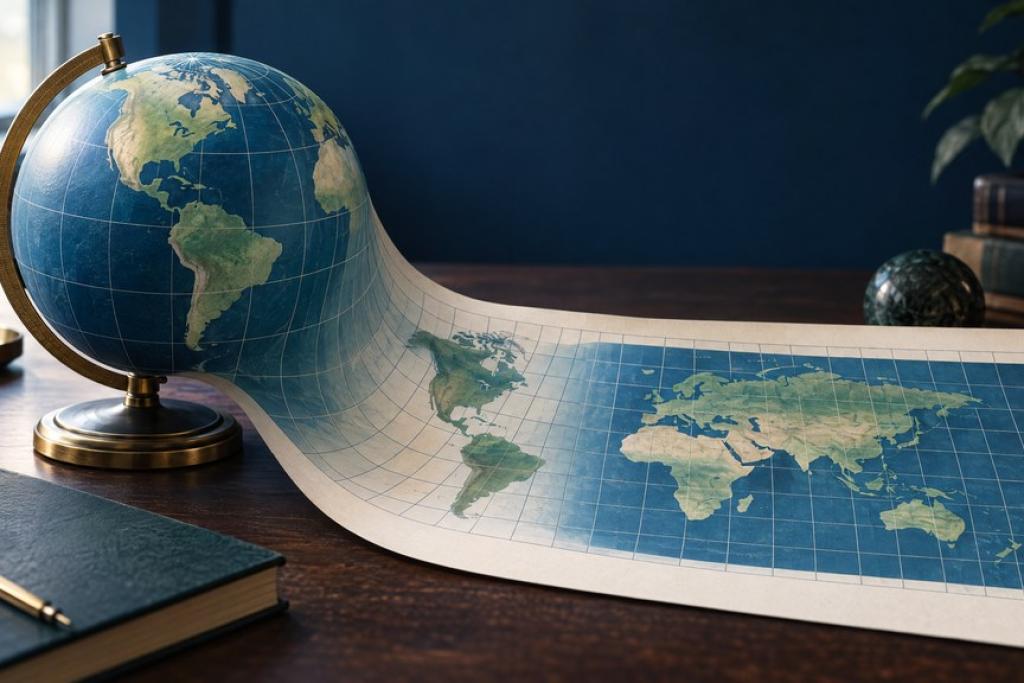
Every map projection is a compromise. A map projection turns Earth’s curved surface into a flat image, and that translation inevitably bends some combination of area, shape, distance or direction. The result is not inherently a wrong map so much as a tool optimized for a particular job—and a reminder that a map’s familiar look is not the same thing as geographic truth.
Why the globe cannot be flattened perfectly
Imagine peeling an orange and trying to press its curved skin onto a table without tearing, stretching or leaving gaps. Earth presents the same geometric problem: its surface curves in two directions, while a sheet is flat. No mathematical projection can preserve every relationship everywhere. According to the U.S. Geological Survey, flat maps can show one or more of true directions, distances, areas and shapes, but cannot preserve all of them at once. NASA’s Scientific Visualization Studio makes the trade-off visible by tracking equal-sized circles as they morph across projections: those circles change size or shape depending on the map.
Distortion is not evenly distributed, either. It depends on the projection and on where a place sits relative to its center or standard lines. Scale matters too: the USGS notes that a world Mercator map exaggerates high-latitude distortion, while a properly designed large-scale Transverse Mercator map can represent a local high-latitude region quite accurately. So “Mercator distorts” is a useful global warning, not a verdict on every map using a projection with Mercator in its name.
Mercator is useful for direction—not comparing land size
The classic Mercator projection became a practical navigation chart because any straight line on it follows a rhumb line: a route that holds a constant compass direction. That can help a navigator plot a steady bearing. It does not mean that the straight line is usually the shortest path; the shortest route on a globe follows a great circle, which often curves on a Mercator map. The projection is conformal, preserving local angles and the shapes of small features, but it expands scale sharply toward the poles. That inflates the apparent area of high-latitude places, so Mercator is a poor choice for comparing continents.
Consider Greenland and Africa. Greenland can look almost continent-sized on a familiar rectangular Mercator world map, but that visual impression is a projection effect. According to National Geographic Education’s projection explainer, Africa’s actual area is about 14 times Greenland’s. The comparison is a quick reality check: Mercator’s expanding scale at high latitudes makes Greenland look far larger relative to Africa than its true area warrants. The map’s geometry explains the appearance; that geometry alone does not prove a political motive or accusation about why someone selected it.
Equal area changes the question
An equal-area map preserves relative area: if one region covers twice as much ground as another, it also occupies twice the map area at a consistent scale. That makes these projections valuable for choropleth data, land-use comparisons, population density, climate patterns and lessons about continental size. The cost is that shapes, angles or directions must give way somewhere. On the cylindrical Gall-Peters projection, for example, areas are proportional, but countries near the equator can look stretched north-to-south and those at higher latitudes compressed.
Equal Earth is another equal-area choice, designed by cartographers Bojan Šavrič, Tom Patterson and Bernhard Jenny. In their peer-reviewed paper, they describe it as a world projection inspired by the familiar Robinson look while retaining relative area; its creators also say its curved sides evoke a globe. Equal Earth can therefore give a more balanced-looking world map for area comparisons than Gall-Peters, without making every country’s shape true. Equal-area names the property a projection preserves, not a claim that it is distortion-free.
Choose the view that fits your question
According to the USGS, there is no single best map projection for every use. Start by asking what you need the map to tell you. For a fixed compass bearing or a web map focused on a small region, Mercator can be useful—just avoid reading its world view as an area comparison. For comparing countries or mapping a global dataset by area, choose an equal-area option such as Equal Earth or Gall-Peters. For a general classroom or wall map, a balanced compromise projection may look more natural, but check whether it preserves the statistic you plan to discuss.
Then inspect the legend or map settings: look for the projection name, map scale, geographic extent and, for data maps, whether the symbol or color encodes raw count, rate or area-normalized value. If you are comparing a large region’s shape or area, check the same data in a second projection—or reach for a globe. For your next map, the practical test is simple: name the relationship that matters most before choosing the view. A map projection is best judged by whether it serves the purpose honestly.
Sources: The U.S. Geological Survey’s guide to projection uses and its Map Projections reference; NASA’s Scientific Visualization Studio, “Map Projections Morph”; National Geographic Education, “Selecting a Map Projection”; and the Equal Earth creators’ peer-reviewed paper.
Comments 0
No comments yet. Be the first to share your thoughts!
Leave a comment
Share your thoughts. Your email will not be published.